Getting Started with LogStash on Windows using Docker and nxlog
Summary
Today we’re going to be doing the absolute bare minimum to get up and running using LogStash in an ELK (Elasticsearch, Logstash, Kibana) setup to aggregate Windows event logs.
To do this we’re going to use:
- Docker container willdurand/elk
- Boot2Docker (as we’re on Windows)
- nxLog (as a Windows log shipping agent)
Why nxLog instead of logstash-forwarder? Just simplicity at this stage, we’re doing the bare minimum to get up and running, and an installer and a plethora of predefined Windows nxLog configs made that easy. I hope to do some research into a more in-depth comparison of nxLog vs logstash-forwarder on Windows at some point, but that’s not today!
Setting up Docker & the ELK container
Install VirtualBox from here.
Install Boot2Docker from here.
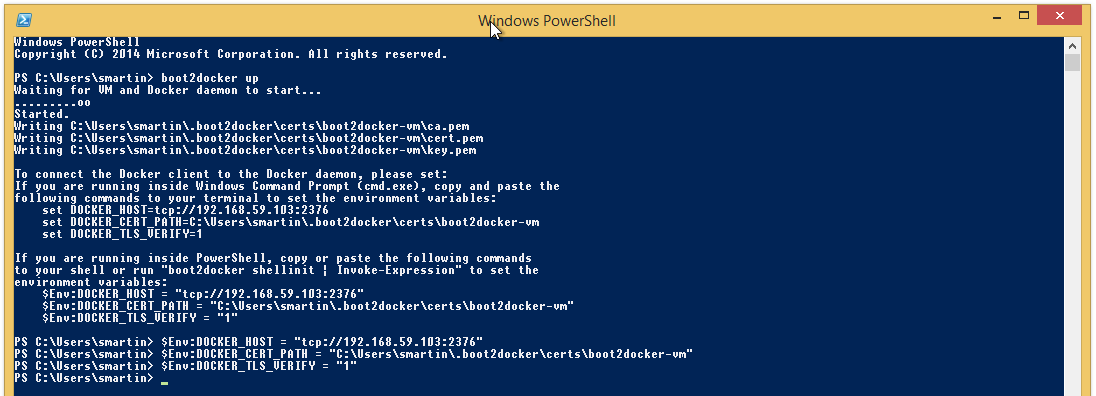
Open a new PowerShell window and run
boot2docker up
Then execute the 3 lines of environment variables it prompts you to run
 Now, because the Boot2Docker VM automatically sharesC:\Users on your host machine as /c/users internally, we’re going to create a “logstash” folder in your Documents folder, and a* logstash.conf* text file within that.

Populate that log file with the following very simple config
input { udp { type => "WindowsLog" codec => json port => 3515 } } output { elasticsearch { host => "127.0.0.1" cluster => "logstash" } }
Excellent! We can now download and start our container! In the same PowerShell window enter the following (editing line 2 to reflect your documents path):
docker run -p 80:80 -p 3515:3515/udp -v /c/Users/smartin/Documents/logstash:/etc/logstash willdurand/elk
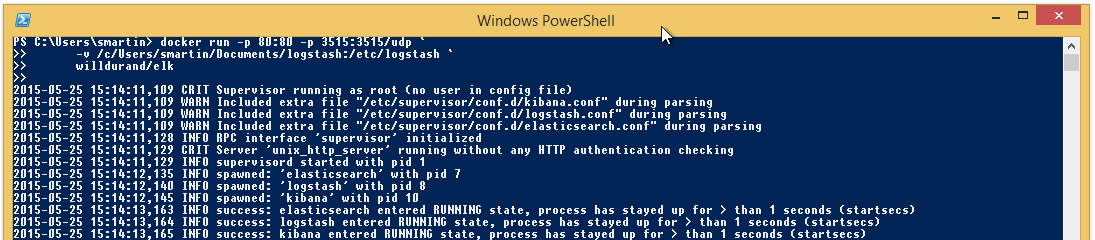
(Yours will look different if you haven’t downloaded wildurand/elk previously.)
Excellent! So long as logstash isn’t restarting every few seconds (which suggests you have a syntax error in your config) we can proceed to setup our Windows log agent!
Setting up NxLog
I chose to install NxLog on my host computer to save spinning up a Windows VM which takes forever. You can install it on a VM if you prefer, just make sure that you give it a NIC which has access to VirtualBox’s Host-Only Adapter, as we’ll be using that to communicate with LogStash!
Before we start, we need the IP of the boot2docker VM. In a Powershell window that is the same security context as the one you ran boot2docker in (i.e. administrative or non-administrative), run the following command.
Boot2Docker ip
Now download and install NxLog from here.
Open up C:\Program Files (x86)\nxlog\data\nxlog.conf and enter the following
## configuration options. It should be installed locally and is also available
## online at http://nxlog.org/nxlog-docs/en/nxlog-reference-manual.html

## Please set the ROOT to the folder your nxlog was installed into,
## otherwise it will not start.

#define ROOT C:Program Filesnxlog
define ROOT C:Program Files (x86)nxlog

Moduledir %ROOT%\modules
CacheDir %ROOT%\data
Pidfile %ROOT%\data\nxlog.pid
SpoolDir %ROOT%\data
LogFile %ROOT%\data\nxlog.log
LogLevel INFO

<Extension charconv>
Module xm_charconv
AutodetectCharsets utf-8, euc-jp, utf-16, utf-32, iso8859-2
</Extension>

<Extension json>
Module xm_json
</Extension>

<Input in>
Module im_msvistalog
Query <QueryList>
<Query Id="0">
<Select Path="Application">*</Select>
<Select Path="System">*</Select>
<Select Path="Security">*</Select>
</Query>
</QueryList>
Exec convert_fields("AUTO", "utf-8");

# For windows 2003 and earlier use the following:
# Module im_mseventlog
Exec to_json();
</Input>

<Output out>
Module om_udp
Host 192.168.59.103
Port 3515
</Output>

<Output file_out_test>
Module om_file
File 'C:\Program Files (x86)\nxlog\data\nxlog\testout.log'
</Output>

<Route 1>
Path in => out
</Route>

<Route logstash_debug>
Path in => file_out_test
</Route>
Customising the host IP to reflect the IP you got earlier from the boot2docker ip command.
The logstash_debug file isn’t strictly necessary, but is helpful to confirm that nxlog is actually sending log entries somewhere. Be sure to clean this up before using this anywhere that matters!
Once that’s done, start the service (you’ll need to be in an administrative PowerShell window naturally).
Start-Service nxlog
You should immediately see C:Program Files (x86)nxlogdatanxlogtestout.log be created and start filling up.
Browsing Kibana
Okay, hopefully all’s gone well so far! Now we can get to the good stuff (in this case, your logs in Kibana).
Then copy and paste the IP you retrieved earlier using boot2docker ip into your browser and… Voila!
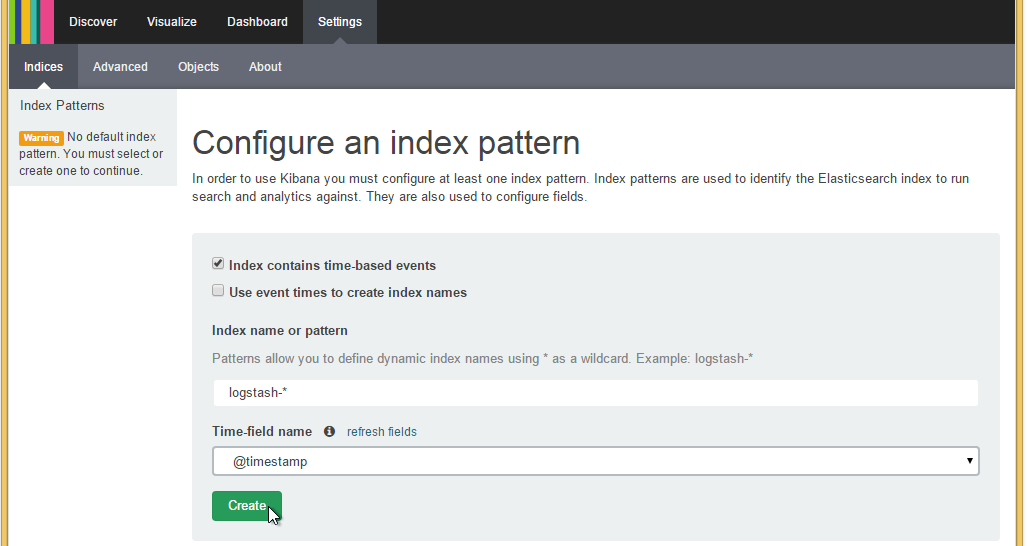
Select the only time-field name option available to you, click create and you are live.
To see your logs, click the discover button.
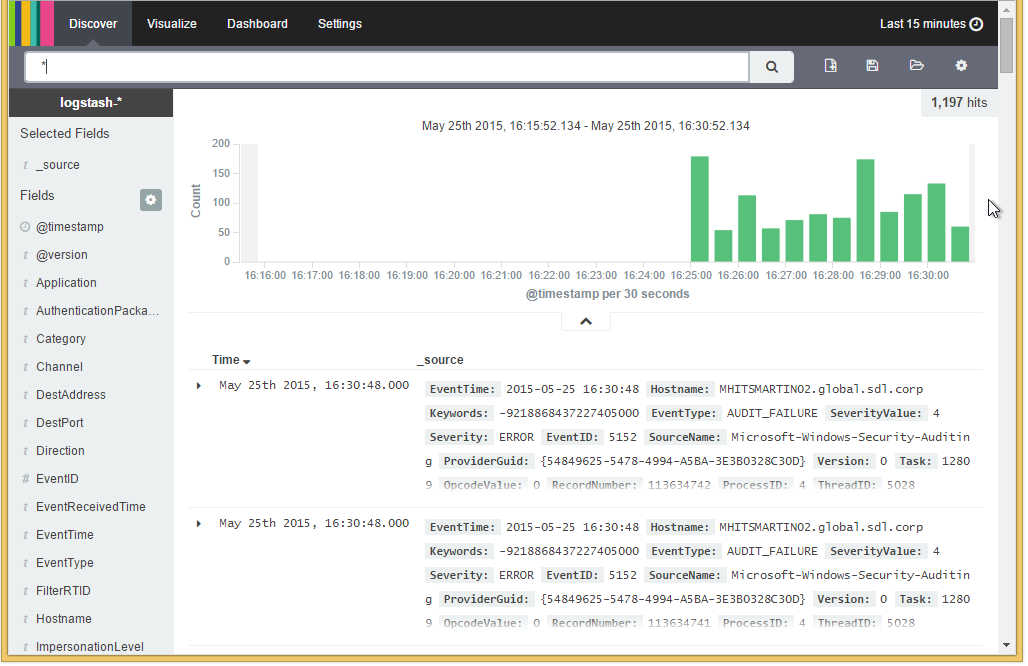
While it’s a relatively daunting interface to start off with, you’ll soon get used to it.
Before we do anything else though, let’s test it out by creating a new log entry in the Application Windows Event Log.
In your PowerShell window execute the following:
New-EventLog –LogName Application –Source "Hello LogStash" -ErrorAction SilentlyContinue
Write-EventLog –LogName Application –Source "Hello Logstash" –EntryType Information –EventID 1 –Message "Don't panic!"
Now go back to your Kibana browser window and enter the following (capitalisation is important):
Message:panic
Then click the search icon!
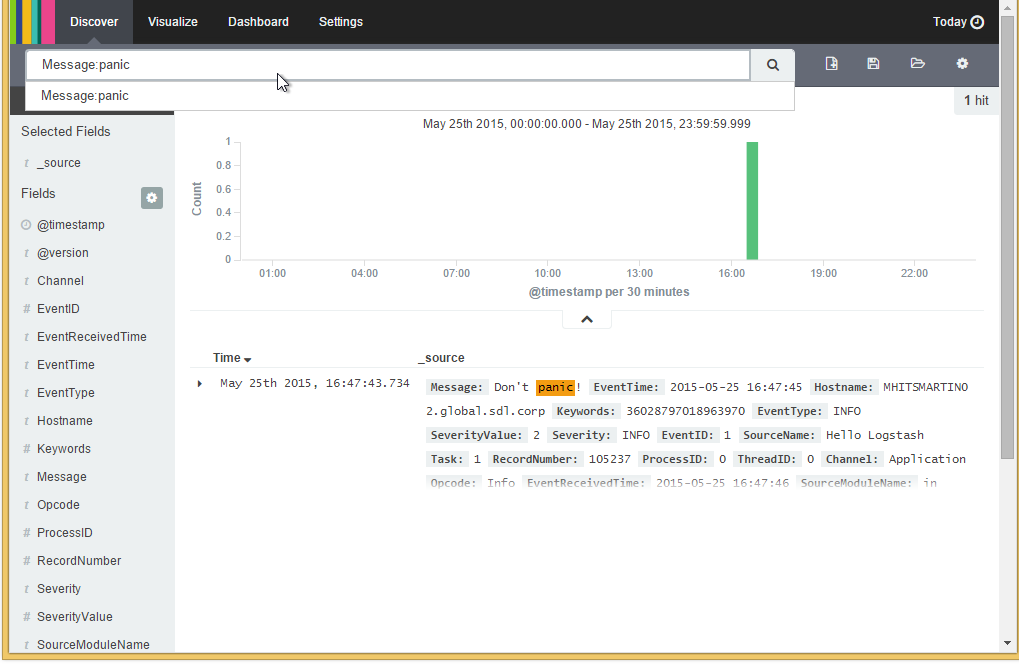
Hurrah! We’re aggregating live logs!
Now go and figure out how to search Kibana properly with https://www.mjt.me.uk/posts/kibana-101/.
Then go and figure out how to consume other log types
- http://nxlog-ce.sourceforge.net/nxlog-docs/en/nxlog-reference-manual.html#modules_input
- https://www.elastic.co/guide/en/logstash/current/pipeline.html
Further Reading
The above draws heavily from the below articles. All I did was tie them together.
- http://stackoverflow.com/questions/25685650/why-do-people-ship-logs-to-logstash-with-nxlog-and-not-logstash-itself
- http://www.ragingcomputer.com/2014/02/sending-windows-event-logs-to-logstash-elasticsearch-kibana-with-nxlog
- http://williamdurand.fr/2014/12/17/elasticsearch-logstash-kibana-with-docker/
- http://www.alexlinux.com/logstash-windows-nxlog-config-example/
- https://www.mjt.me.uk/posts/kibana-101/
- http://nxlog-ce.sourceforge.net/nxlog-docs/en/nxlog-reference-manual.html#modules_input