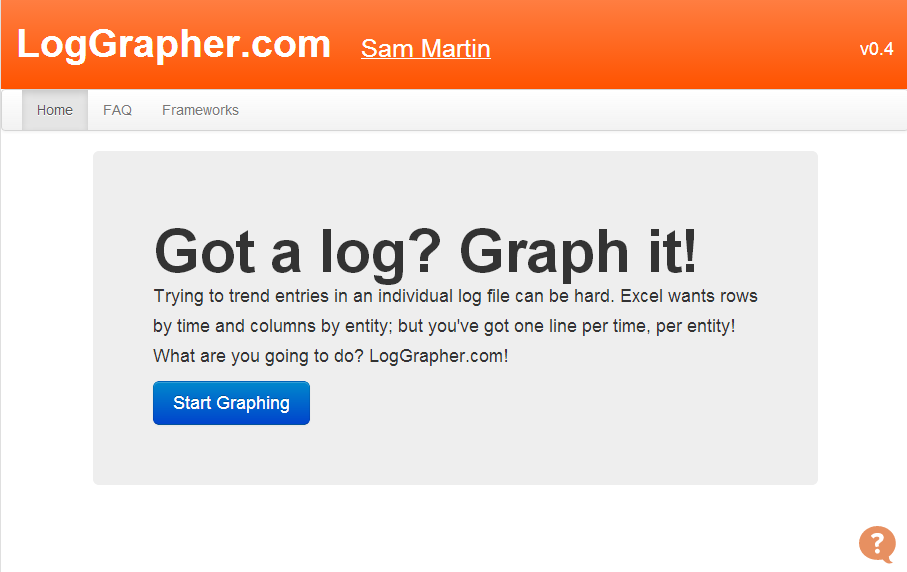
LogGrapher.com
It’s finally here!
I started working on loggrapher.com at the beginning of last year after getting frustrated with vCenter’s tiny, inflexible charts and Excel’s inability to deal with values that were ‘per line’ rather than ‘per column’.
It’s designed to deal with any line-graphable performance data (though I hope to add event-log graphing at a later date) that is formatted in CSV (UTF-8).
Coding loggrapher.com proved something of a challenge. Partly because I used it as an opportunity to finally start coding object oriented JavaScript, and partly because I wanted to make it very easy to use. At least as much time has been consulting my girlfriend (an aspiring UX designer) on the usability and layout, as has been spent in figuring out how to code it.
Performance
The most difficult aspect however, was the performance. The logs I wanted to parse were frequently more than 100MB in size, and as I wanted to make this available to the public, I was determined not to incur any server-side manipulation costs. This meant manipulating all the data in client side JavaScript, a problem I’d never tackled before.
Getting the CSV into memory was the first hurdle, even FileReader was new to me (and I’m still annoyed that readAsText was deprecated, as it was a lot less hassle than readAsArrayBuffer), I had to split up the file into 100,000 byte chunks, as trying to read it all at once resulted in the browser crashing more often than not.
Then there was the processing of the CSV, converting it from something like
“17”,”09/03/2013 19:31:00″,”vmhost3 – vmdatastore04″
“0”,”09/03/2013 19:31:00″,”vmhost3 – vmdatastore03″
“1”,”09/03/2013 19:31:00″,”vmhost4 – vmdatastore02″
into a JavaScript object that the graphing plugin could read, took tens of seconds. Not a long time to wait for your graph, but long enough for browser to decide that the JavaScript had hung, and mark the tab as crashed.
Enter, web workers, another new frontier for myself. They allow you to send an object off to a script you’ve defined in a separate .js file, which will then crunch your object in a different thread (thereby preventing UI draw blocking) and spit the result back out. They’re not much fun to work with, as you you can’t use any additional plugins in the separate thread, won’t get any errors from the separate thread, and obviously can’t manipulate the DOM from the separate thread. However, they were absolutely perfect for what I was wanting to do.
So I’d managed to load the CSV into memory, parse it into a format that made sense to the charting plugin, phew, that’s my work done! Over to the plugin to actually do all the clever stuff and draw everything. And there we hit another snag. Originally I was using HighCharts to do the graph rendering. However, HighCharts doesn’t do well with more than 30,000 points, and goes to a simpler TurboMode after (by default) 1000 points. This was a problem, I wanted to render 200,0000+ points. After checking all the more common (jqPlot, charts.js, jsCharts,gRaphaël, etc…) I was starting to despair. Until I happened across jqChart, which specifically boasts high performance. My initial testing proved it could handle up to 2,000,000 points and still be workable (slow, but workable). I can’t express how awesome jqChart is. So much faster than its competitors, and still incredibly flexible and easy to use.
Use Case
Using vCenter on a daily basis is great, using it without vcOps? Less great. That’s where our friends PowerShell, PowerCLI and specifically, Get-Stat come in handy!
Say we wanted to get the realtime CPU stats for a given VM, open up the PowerCLI console window and try the following:
Connect-Viserver localhost
Get-Stat -entity $(get-vm vmname) -realtime -stat cpu.usage.average | export-csv C:vmname-cpustats.csv
Replacing “VMName” with your VMs name, and the filename with something to your liking, of course!
Then you simply navigate to loggrapher.com (in a compatible browser!), click Start Graphing, configure your first log source, select the file, select the columns, make sure the date format is correct, then graph away!
Using It – Feedback Please!
As I mentioned earlier, one of the objectives with this tool was to make it easy to use. However, it’s not until it’s released into the wild that it becomes obvious how difficult a given piece of software is to use. Any and all feedback would be very much appreciated, there is a brief FAQ that I hope addresses some of the questions people might have concerning it. But please leave a comment, or use the UserVoice page.
If you need some data to get started with, you can download an example CSV file here.
Happy graphing!
