Reporting on PagerDuty call outs with Splunk
Pagerduty has a pretty kickass reporting feature, but my aim is to create a holistic dashboard for my team’s operational work, and to do that I need to have all my data in one place. That one place? Splunk!
I love Splunk, have done ever since seeing a presentation on it years ago, but for a long time it stayed out of reach for mere mortals due to its price point. However, that seems to have dropped massively while I wasn’t looking. Where previously it seemed like Splunk wouldn’t get out of bed for less than quarter of a million a year, now you can get a hosted solution ingesting tens of gigabytes a day for only a few tens of thousand pounds a year.
The Plan
Ultimately what I want to build is a one-stop shop for Team Metrics, and this is just the first (and possibly most important) step towards that. I considered using Etsy’s Ops Weekly tool, but didn’t want to introduce a manual logging component at this early stage in a new team. Also one of the major design drivers behind OpsWeekly is integration with sleep-tracking tools which while awesomely cool for a data nerd like me, is a little Orwellian and not something I wanted to float so early into a new job.
Our objective with this overarching project of capturing, consolidating, and displaying ‘Team Metrics’ is to fulfil one of the most important principles of LEAN: making things visible. If it’s not visible you can’t measure your improvement, and if you can’t measure your improvement you’re relegated to guesswork rather than experimentation. Failing fast and often is only good if you can learn from it, and to learn we need Metrics!
I chose PagerDuty as a good place to start as it’s a great warning factor for burnout risk and counter indicator of individual health/wellbeing. If your team isn’t getting enough sleep it’s not going to be long before they start becoming extremely unhappy, checking out mentally and starting to look for a less stressful job.
Anyway, to get the overview we’re looking for we’ll need three components:
- An event driven RESTful endpoint that PagerDuty will call out to add new events
- A tool to bulk-import our PagerDuty history
- Some defined reports to show us our data
I’ve created #2 and #3 already (#1 I’ll do another blog post on later), and that’s enough for us to start ingesting and reporting on data, so let’s get cracking!
Setup
You’ll need to get API keys for both PagerDuty and Splunk.
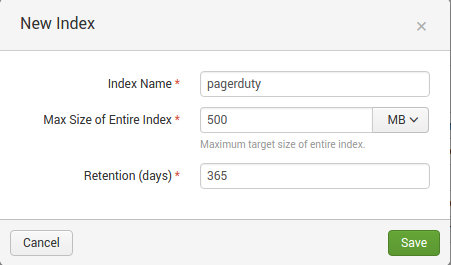
You can find instructions on Splunk’s website for Using the HTTP Event Collector. Make sure you create a new index with an appropriate size and age limit like I have:
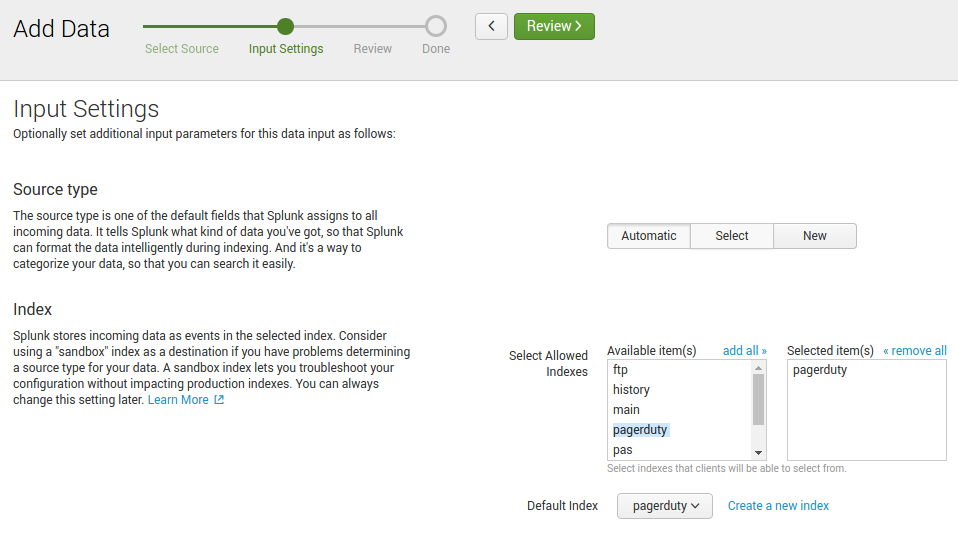
You’ll also need to make sure you give the new HTTP Event access to this index and set it as its default like so:
PagerDuty’s API requires less setup as we’re only reading data, just refer to this document on their site: Generating an API Key. Make sure you create a V2 API key otherwise it won’t work!
Importing the Data
With that out the way, you can download tool I’ve created: PagerDuty2Splunk. You’ll need Python (probably 2.7 is most compatible), and once installed run:
pip install pagerduty2splunk
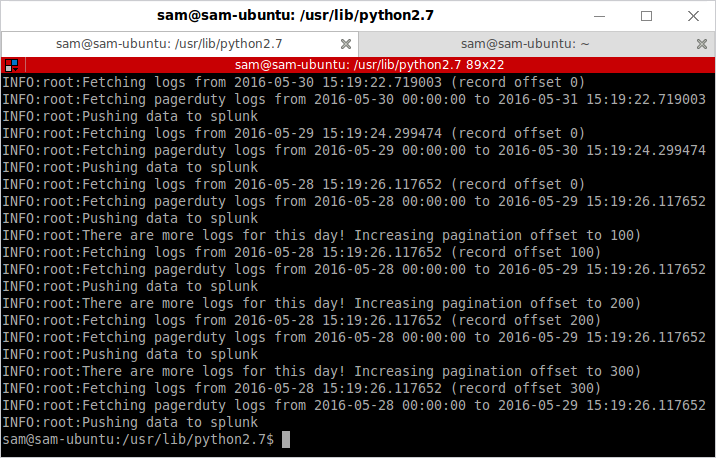
Now all you need do is execute it, passing the details of your Splunk and PagerDuty APIs.
pagerduty2splunk --log=INFO --start=2016-01-01 --end=2015-01-05 --splunk-token=XXXXXXXX-XXXX-XXXX-XXXX-XXXXXXXXXXXX --splunk-instance-id=prd-X-XXXXX --pagerduty-token=XXX-XXXXXXXXXXXXXXXX
splunk-token and pagerduty-token are pretty self-explanatory as the API keys that you generated in Setup earlier, splunk-instance-id is the subdomain of your Splunk Cloud url (i.e. the bit that comes before cloud.splunk.com when you go to access your Splunk instance).
start and end are the YYYY-MM-DD formatted dates that you want to pull logs from PagerDuty between. (You can also use number of days relative to today if you wish, see the GitHub page for more examples.)
Once that’s complete (it will take a while if you’ve selected a large number of days!), you should be able to search your index in Splunk with a query like:
index=pagerduty
Which should show everything that you’ve just imported.
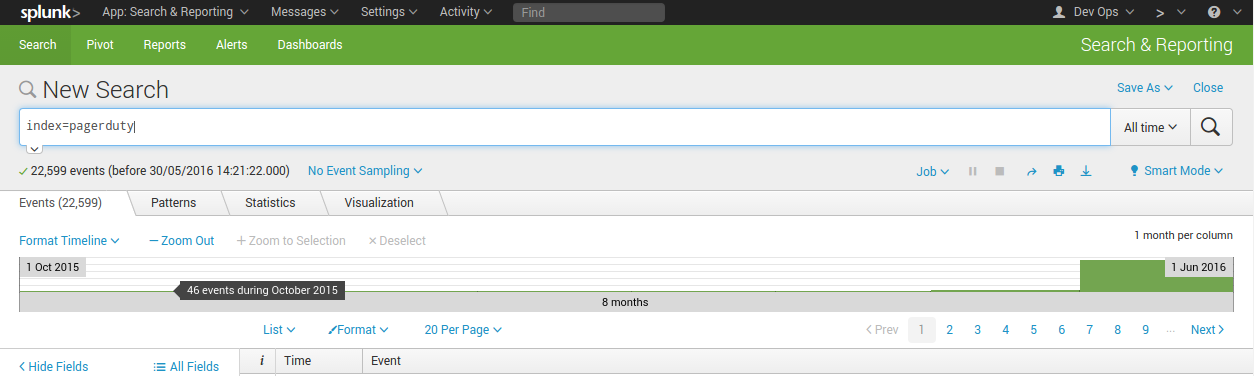
Wonderful!
Building a Dashboard
I’m pretty new to Splunk, so probably some-one else can come up with something much better than what I’ve created here, but this is a start for you:
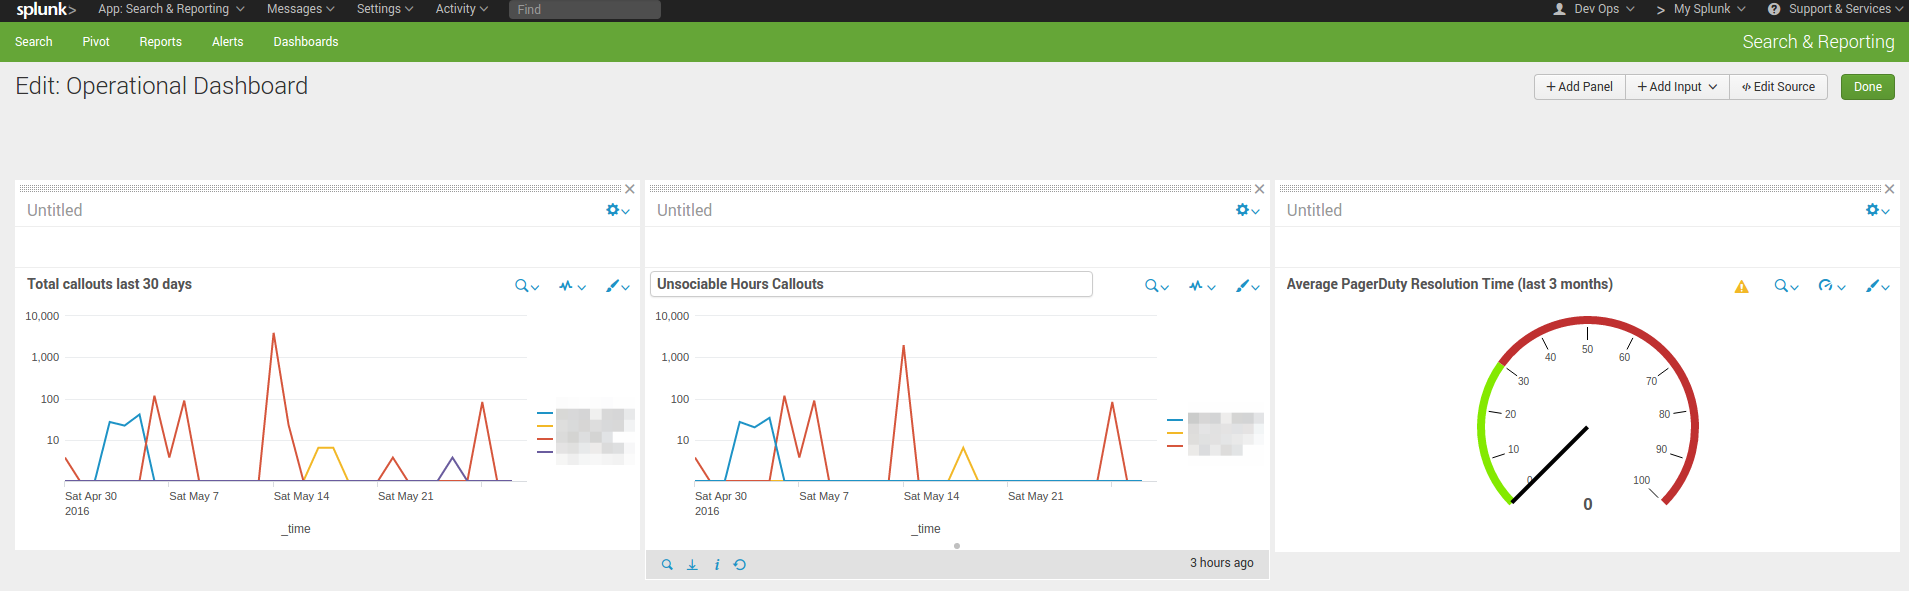
The exported code for the dashboard is pretty long so I’ve popped it in Gist: PagerDuty Operational Dashboard in Splunk.
You can paste this code into any new Dashboard you’ve created by going to the top right of the dashboard and clicking “Edit” > “Edit Source”.
And that’s it! I’m going to do a follow-up post when I’ve created an Azure Function to receive new events (I’d rather not to manual exports regularly!). But this should get you started to see what sort of power is available when you bring your PagerDuty metrics into Splunk.